
The IronJacamar tracer
The Java EE Connector Architecture ConnectionEventListener 's are a key part of the specification, as they are responsible for maintaining the relationship between the ManagedConnection and the application handles, and their state inside the container. It is also through the ConnectionEventListener that the XAResource instance is enlisted, and delisted from the transaction - if supported - either through LocalTransaction or XATransaction . While IronJacamar generates useful TRACE log about these interactions the amount of data can be too much for humans to process within a reasonable time frame. The IronJacamar tracer produces machine-readable codes at a special TRACE log category at key points during the entire interaction of the ConnectionEventListener making it easy to apply tooling of the data collected. An example of a code could be
IJTRACER-TxLog-3-1400076333382-578a5496-
which isn't very useful.
However, looking at the entire interaction as a UML sequence diagram is
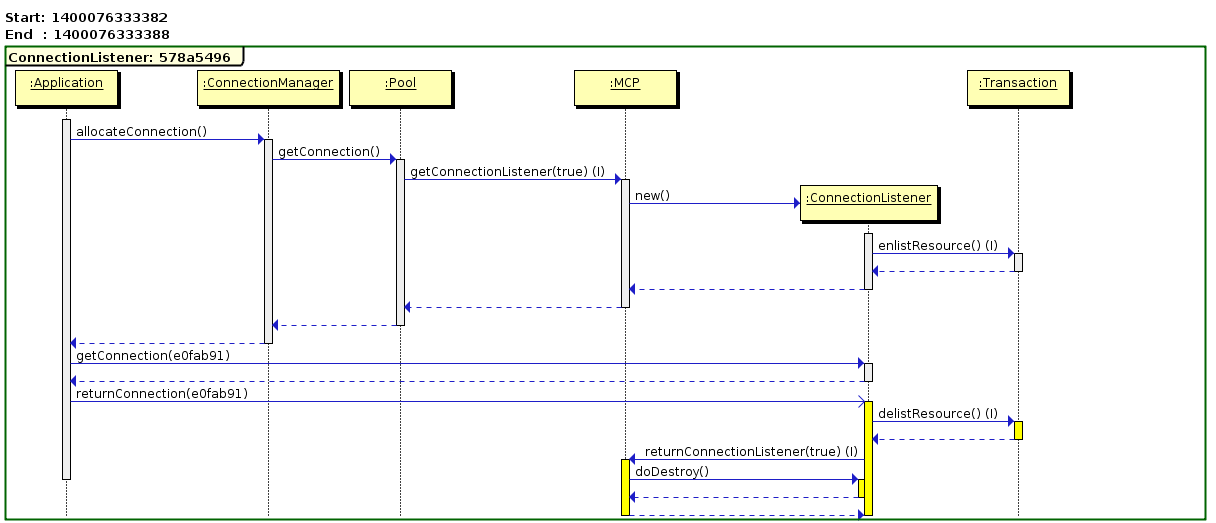 included in the
HTML report
generated by the tracer-report application.
The generated report is broken down into a
included in the
HTML report
generated by the tracer-report application.
The generated report is broken down into a
- Pool
- ConnectionListener
- Timestamp
org.jboss.jca.core.tracer.Tracer.setEnabled(true);
method.
We hope that you will find this feature useful when tracking down problems, and we will of course keep expanding
the functionality of the tracer and associated tools.